PySAM DOE Data Prize Webinar#
Modeling capabilities of PySAM and pvlib with use cases for DOE Data Prize datasets#
Setting up PySAM case#
1. Import PySAM modules#
2. Load in weather data#
3. Set up PV system design#
4. Run model timestep-by-timestep#
5. Compare results to measured plant data#
6. Extra model features for monitoring, etc.#
#Setting up PySAM
#bring in PV module
import PySAM as pysam
import PySAM.Pvsamv1 as pv
#bring in LCOE calculator for example
import PySAM.Lcoefcr as lcoe
import matplotlib.pyplot as plt
import pandas as pd #Data processing
import json
import datetime
import PySAM.ResourceTools
Weather Data#
Option 1. Read from file#
-Use SAM weather file formats such as that downloaded from NSRDB

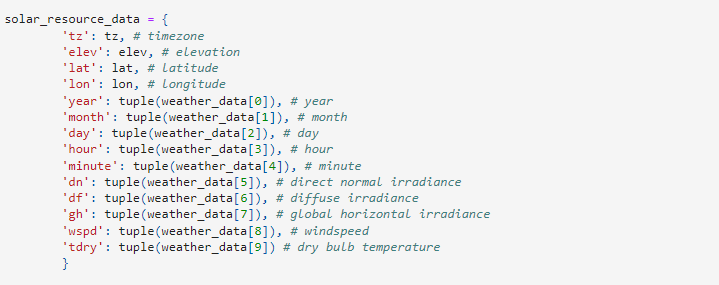
Option 2: Read from dictionary#
-solar_resource_data dictionary can store values for ‘dhi’, ‘ghi’, ‘dni’, ‘poa’, ‘tamb’, etc. for full year, partial year, or single time step simulations
DOE Data Prize Datasets#
System 9068 (SR_CO) system
Single-axis tracking system
#Weather data
#Additional data access tools available at https://github.com/NREL/pvdaq_access
weather_data_prize = pd.read_csv('9068_irradiance_data.csv')
amb_weather_data = pd.read_csv('9068_environment_data.csv')
weather_data_prize["measured_on"] = pd.DatetimeIndex(pd.to_datetime(weather_data_prize["measured_on"], utc=False))
weather_data_prize = weather_data_prize.set_index("measured_on")
weather_data_prize.head()

amb_weather_data["measured_on"] = pd.DatetimeIndex(pd.to_datetime(amb_weather_data["measured_on"], utc=False))
amb_weather_data = amb_weather_data.set_index("measured_on")
amb_weather_data.head()
| weather_station_ambient_temperature_(c)_o_149727 | thermocouple_pad_1_back-of-module_temperature_1_(c)_o_149728 | thermocouple_pad_1_back-of-module_temperature_2_(c)_o_149729 | thermocouple_pad_2_back-of-module_temperature_1_(c)_o_149730 | thermocouple_pad_2_back-of-module_temperature_2_(c)_o_149731 | wind_sensor_max_wind_speed_(m/s)_o_149732 | wind_sensor_wind_direction_o_149733 | wind_sensor_wind_direction_fast_o_149735 | wind_sensor_wind_speed_(m/s)_o_149736 | wind_sensor_wind_speed_fast_(m/s)_o_149737 | ... | inverter_module_2.4_temperature_t2_(c)_inv_149817 | inverter_module_2.4_temperature_t3_(c)_inv_149818 | inverter_1_max_igbt_temperature_(c)_inv_149819 | inverter_1_min_igbt_temperature_(c)_inv_149820 | inverter_1_derating_ambient_temperature_(c)_inv_149821 | inverter_1_temperature_int_(c)_inv_149822 | inverter_2__max_igbt_temperature_(c)_inv_149823 | inverter_2_min_igbt_temperature_(c)_inv_149824 | inverter_2_derating_ambient_temperature_(c)_inv_149825 | inverter_2_temperature_int_(c)_inv_149826 | |
|---|---|---|---|---|---|---|---|---|---|---|---|---|---|---|---|---|---|---|---|---|---|
| measured_on | |||||||||||||||||||||
| 2017-08-23 17:45:00 | 0.0 | 39.20 | 39.20 | 38.6 | 39.8 | 0.0 | 0.0 | 0.0 | 0.0 | 0.0 | ... | NaN | NaN | NaN | NaN | NaN | NaN | NaN | NaN | NaN | NaN |
| 2017-08-23 17:50:00 | 0.0 | 37.95 | 37.95 | 37.3 | 38.6 | 0.0 | 0.0 | 0.0 | 0.0 | 0.0 | ... | NaN | NaN | NaN | NaN | NaN | NaN | NaN | NaN | NaN | NaN |
| 2017-08-23 17:55:00 | 0.0 | 36.60 | 36.60 | 35.9 | 37.3 | 0.0 | 0.0 | 0.0 | 0.0 | 0.0 | ... | NaN | NaN | NaN | NaN | NaN | NaN | NaN | NaN | NaN | NaN |
| 2017-08-23 18:00:00 | 0.0 | 35.50 | 35.50 | 34.8 | 36.2 | 0.0 | 0.0 | 0.0 | 0.0 | 0.0 | ... | NaN | NaN | NaN | NaN | NaN | NaN | NaN | NaN | NaN | NaN |
| 2017-08-23 18:05:00 | 0.0 | 34.65 | 34.65 | 34.1 | 35.2 | 0.0 | 0.0 | 0.0 | 0.0 | 0.0 | ... | NaN | NaN | NaN | NaN | NaN | NaN | NaN | NaN | NaN | NaN |
5 rows × 99 columns
#Weather data for 2019
weather_data_prize_2019 = weather_data_prize.loc['2019']
amb_weather_data_2019 = amb_weather_data.loc['2019']

weather_data_prize_2019.to_csv('2019_weather_data.csv')
amb_weather_data_2019.to_csv('2019_amb_data.csv')
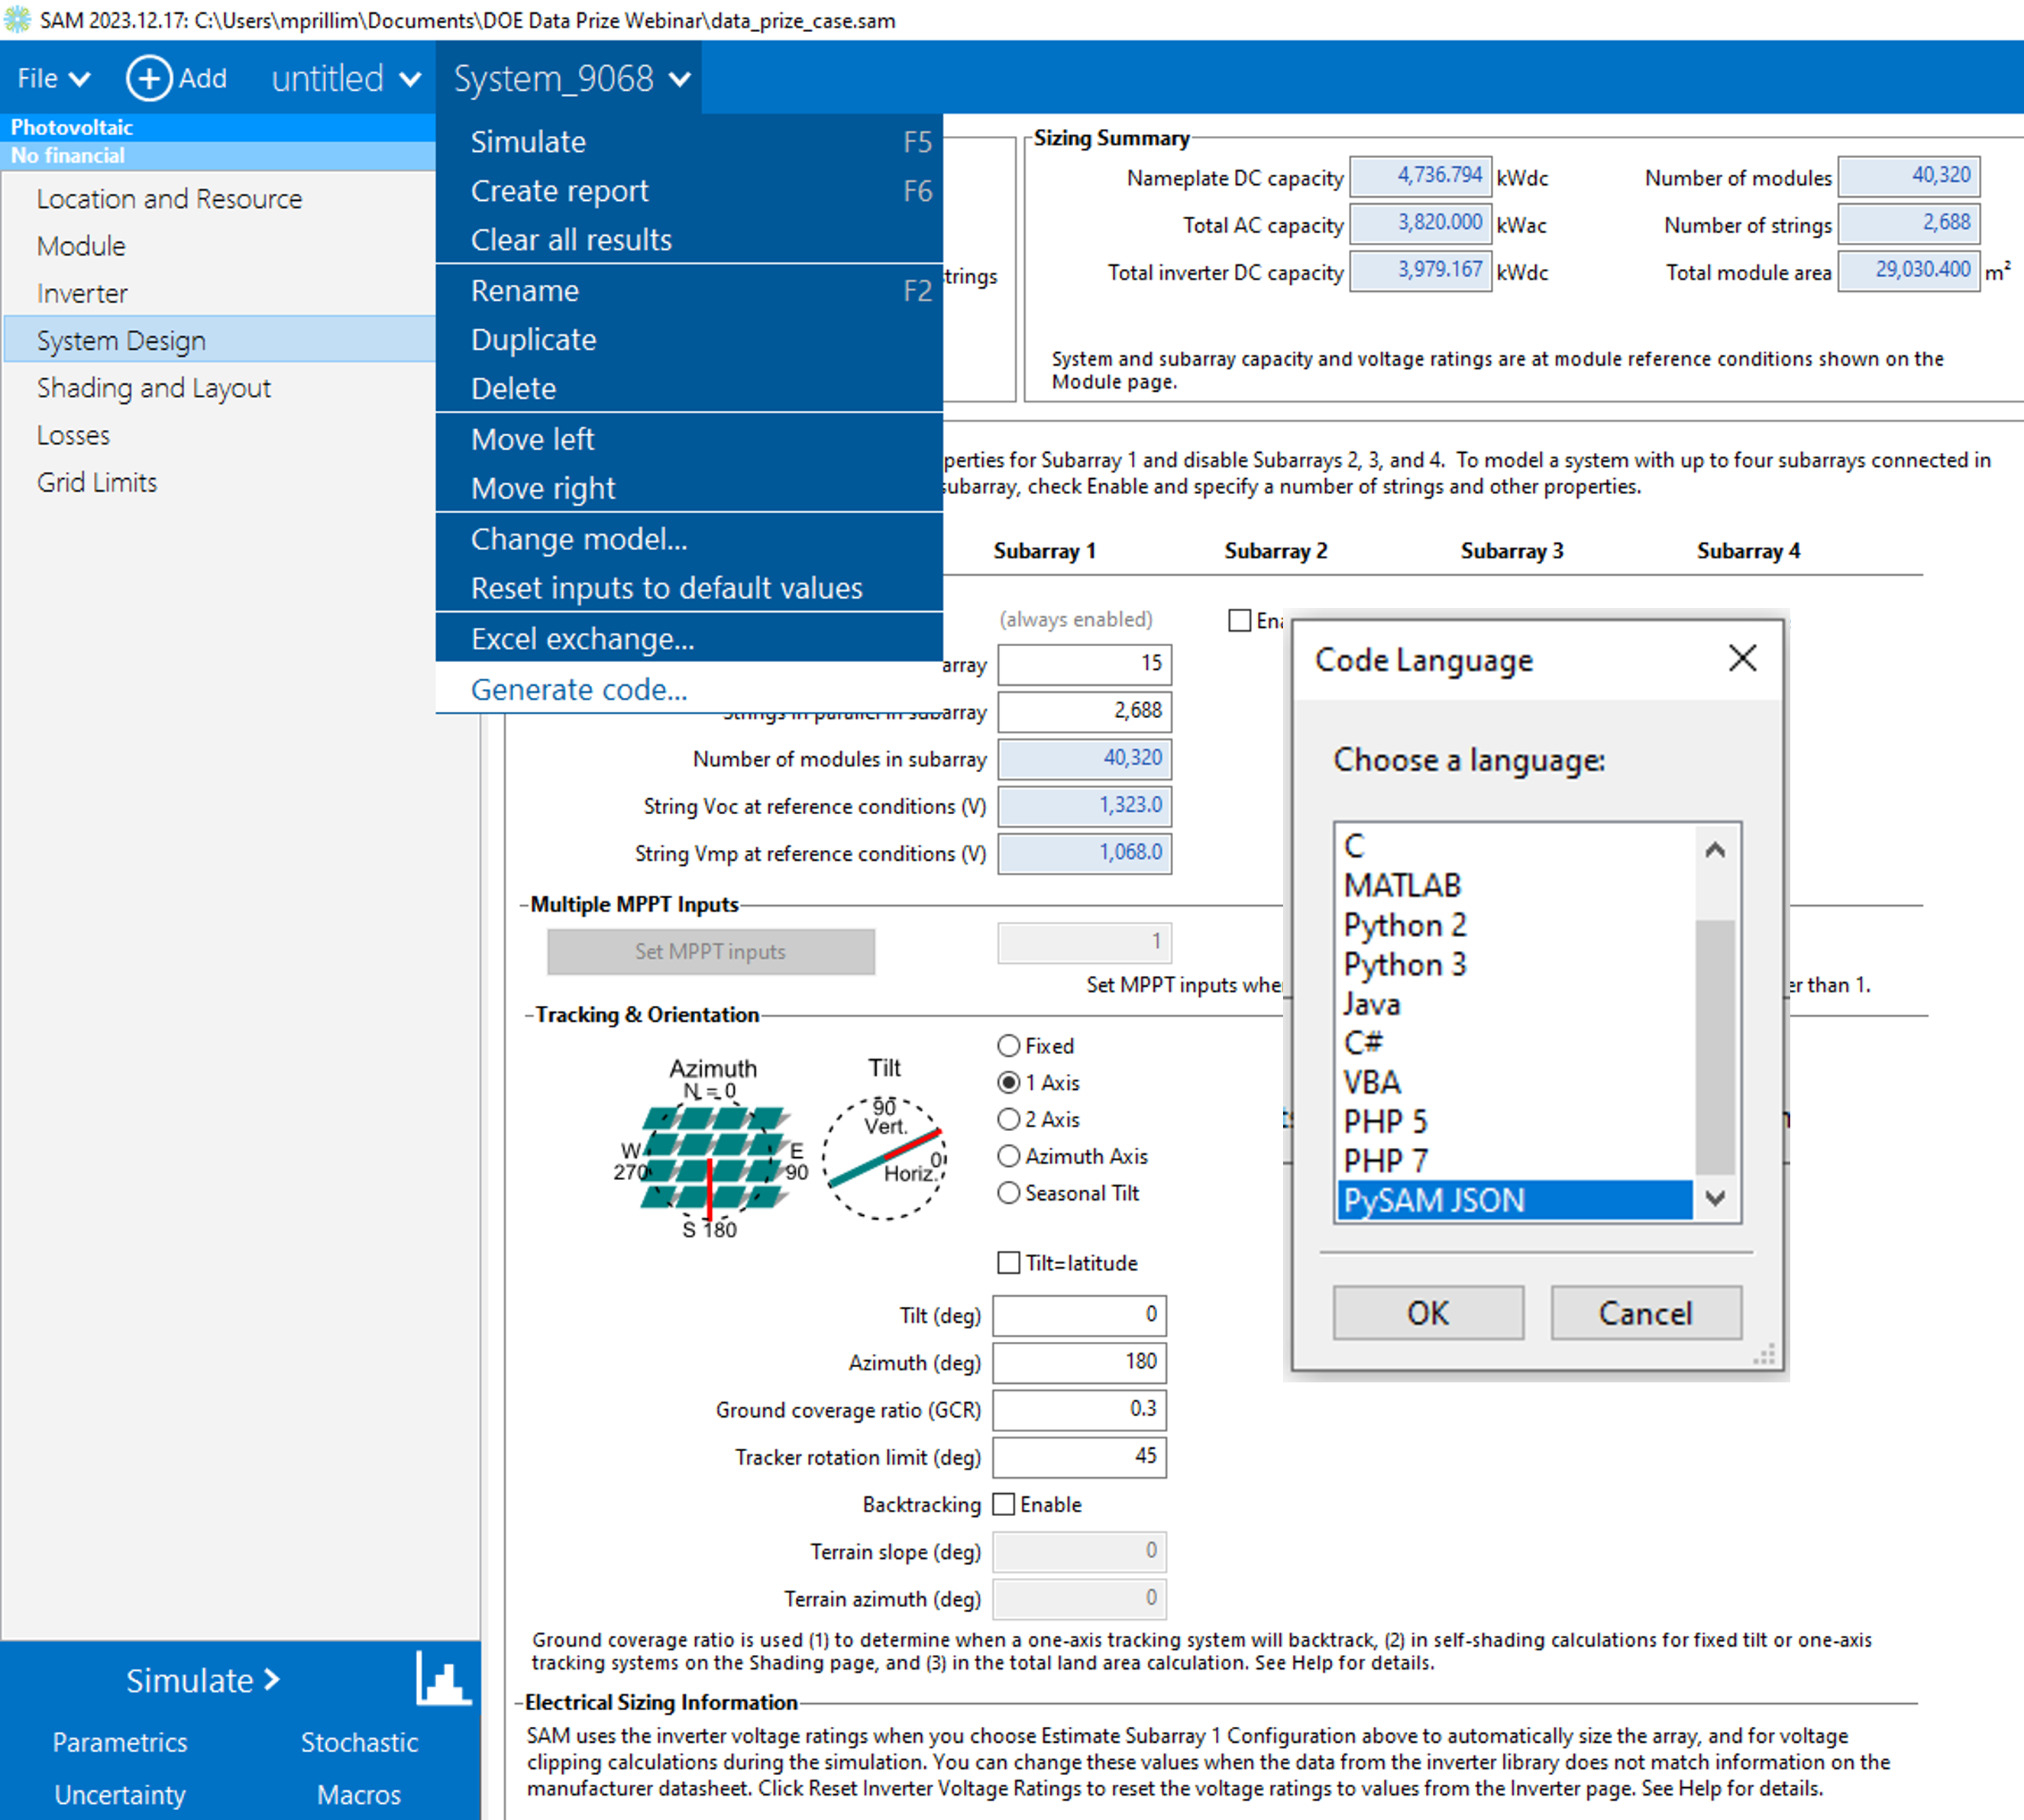
PV System Design#
Option 1 (recommended): set up PV system design in SAM GUI#
Set module, inverter specs
Set modules per string, number of parallel strings
Define tilt (or tracking), azimuth, GCR
Specify system losses
Once system design is set, ‘Generate Code’ to PySAM json
# create a new instance of the Pvsamv1 module
pv_model = pv.new()
# get the inputs from the JSON file from GUI
with open( 'System_9068_pvsamv1.json', 'r') as f:
        pv_inputs = json.load( f )

# iterate through the input key-value pairs and set the module inputs
for k, v in pv_inputs.items():
    if k != 'number_inputs':
        pv_model.value(k, v)
solar_resource_data = {
        'tz': -7, # timezone
        'elev': 1407.0, # elevation
        'lat': 40.3864, # latitude
        'lon': -104.5512, # longitude
        'year': tuple(weather_data_prize_2019.index.year), # year
        'month': tuple(weather_data_prize_2019.index.month), # month
        'day': tuple(weather_data_prize_2019.index.day), # day
        'hour': tuple(weather_data_prize_2019.index.hour), # hour
        'minute': tuple(weather_data_prize_2019.index.minute), # minute
        'poa': tuple(weather_data_prize_2019['pyranometer_(class_a)_pad_2_poa_irradiance_(w/m2)_o_149725']),
        'wspd': tuple(amb_weather_data_2019['wind_sensor_max_wind_speed_(m/s)_o_149732']), # windspeed
        'tdry': tuple(amb_weather_data_2019['weather_station_ambient_temperature_(c)_o_149727']) # dry bulb temperature
        }
#pv_model.SolarResource.assign({'solar_resource_data': solar_resource_data})
#Assign weather data from NSRDB
pv_model.SolarResource.assign({'solar_resource_file': '40.3864_-104.5512_psm3-5min_5_2021.csv'})
Run model#
pv_model.execute() to run SAM module
Outputs in pv_model.Outputs, can export to dictionary with .export()
Time series, annual summation metrics
“gen”: time series kW output
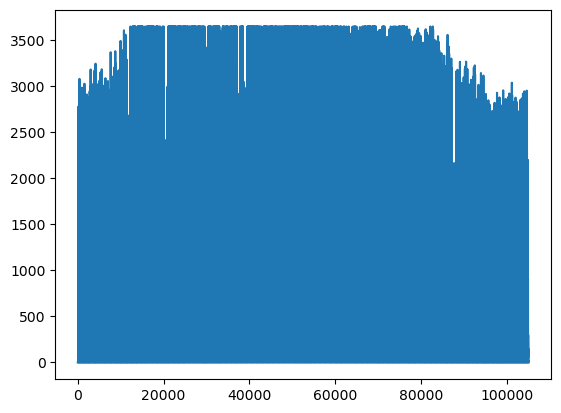
pv_model.execute(0)
out = pv_model.Outputs.export()
predictions = pd.DataFrame({"AC": out["gen"]})
predictions["AC"].plot()
print(pv_model.Outputs.annual_energy, " kWh")
9580759.524304047 kWh
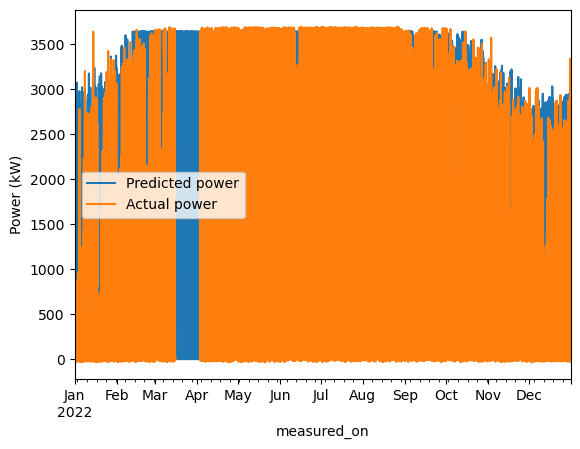
Compare to Measured Data#
-Use measured data to compare against simulated results
-Can compare timestep to timestep (non-annual), or for entire year
measured_data = pd.read_csv("9068_ac_power_data.csv")
measured_data["measured_on"] = pd.DatetimeIndex(pd.to_datetime(measured_data["measured_on"], utc=False))
measured_data = measured_data.set_index("measured_on")
measured_data_ex = measured_data.loc["2022"]
predictions = predictions.set_index(measured_data_ex.index.copy())
measured_data_ex
measured_ac_kw = measured_data_ex["inverter_1_ac_power_(kw)_inv_150143"] + measured_data_ex["inverter_2_ac_power_(kw)_inv_150144"]
predictions['AC'].plot()
measured_ac_kw.plot()
plt.legend(["Predicted power", "Actual power"])
plt.ylabel("Power (kW)")
measured_ac_kwh = measured_ac_kw * 5.0 / 60.0 #5-minute data
Financial Model#
SAM has detailed financial models with discounted cash flows
Front of meter, behind the meter perspectives
Also able to run simple LCOE calculator
lcoe_model = lcoe.new()
lcoe_model.SimpleLCOE.annual_energy = pv_model.Outputs.annual_energy
lcoe_model.SimpleLCOE.capital_cost = 10000000 #capex in $, not based on actual cost data
lcoe_model.SimpleLCOE.fixed_charge_rate = 0.1 #Can be calculated
lcoe_model.SimpleLCOE.fixed_operating_cost = 50000 #annual opex in $, not based on actual cost data
lcoe_model.SimpleLCOE.variable_operating_cost = 0.1 #variable operating cost in $/kWh, not based on actual cost data
lcoe_model.execute()
print("Levelized Cost of Energy:",lcoe_model.Outputs.lcoe_fcr, " $/kWh")
Levelized Cost of Energy: 0.2095946513777333 $/kWh
Non-annual Simulations#
Run subset of year or single time step
Monitor measured vs modeled based on incoming data streams
Focused analysis on segments of year, individual days
Faster parametric sweeps, iteration over input options and ranges
Use solar_resource_data instead of solar_resource_file
pv_model = pv.new()
#Model single inverter instead of both inverters
with open( 'System_9068_Inv_pvsamv1.json', 'r') as f:
        pv_inputs = json.load( f )

# iterate through the input key-value pairs and set the module inputs
for k, v in pv_inputs.items():
    if k != 'number_inputs':
        pv_model.value(k, v)
#Unassign Weather file to use dictionary of weather values instead
pv_model.unassign("solar_resource_file")
#Unassign other annual values
pv_model.unassign("subarray1_shading_timestep")

#Pull weather data from site for specific day with trackers not moving all day (9/16/23)
weather_data_prize_example = weather_data_prize.loc[datetime.date(2023, 9, 16):datetime.date(2023,9,17)]
amb_weather_data_example = amb_weather_data.loc[datetime.date(2023, 9, 16):datetime.date(2023,9,17)]
#weather_data_prize_example = weather_data_prize["2023-9-16"]

#Assign solar_resource_data with poa and solar data from site data
solar_resource_data = {
        'tz': -7, # timezone
        'elev': 1407.0, # elevation
        'lat': 40.3864, # latitude
        'lon': -104.5512, # longitude
        'year': tuple(weather_data_prize_example.index.year), # year
        'month': tuple(weather_data_prize_example.index.month), # month
        'day': tuple(weather_data_prize_example.index.day), # day
        'hour': tuple(weather_data_prize_example.index.hour), # hour
        'minute': tuple(weather_data_prize_example.index.minute), # minute
        'poa': tuple(weather_data_prize_example['pyranometer_(class_a)_pad_2_poa_irradiance_temp_compensated_(w/m2)_o_149726']),
        'wspd': tuple(amb_weather_data_example['wind_sensor_max_wind_speed_(m/s)_o_149732']), # windspeed
        'tdry': tuple(amb_weather_data_example['weather_station_ambient_temperature_(c)_o_149727']) # dry bulb temperature
}

#Assign solar_resource_data to model, set irradiance calculation mode to POA from pyranometer (determined from site metadata)
pv_model.SolarResource.assign({"solar_resource_data": solar_resource_data})
pv_model.SolarResource.assign({"irrad_mode":4}) #4 - POA irradiance from pyranometer
#Run 1 day analysis
pv_model.execute(1)

#Load tracker data
tracker_data = pd.read_csv("9068_tracker_data.csv")
tracker_data["measured_on"] = pd.DatetimeIndex(pd.to_datetime(tracker_data["measured_on"], utc=False))
tracker_data = tracker_data.set_index("measured_on")
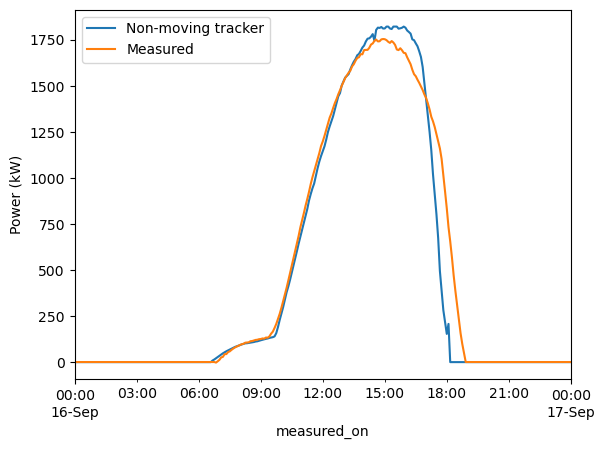
Custom Tracker Rotation Angles#
User-defined tracker rotation angles rather than default SAM sun-following algorithm
SAM covers sun-following tracker algorithm with backtracking, slope-aware backtracking (single fixed slope)
Useful for analyzing misaligned tracker, stuck trackers, custom tracker algorithms
Currently SDK only, looking at desktop tool integration in future
#Pull tracker rotation angles from site data
stuck_tracker_data = tracker_data.loc[datetime.date(2023, 9, 16):datetime.date(2023,9,17), "tracker_1.1-101_tracker_angle_trkr_149827"]

#Turn off custom_rotation_angles
pv_model.SystemDesign.subarray1_use_custom_rot_angles = 0
pv_model.execute(1)
out = pv_model.Outputs.export()
tracker_predictions = pd.DataFrame({"sun_angles": out['subarray1_axisrot']})

#Turn on custom rotation angles, set array to tracker angles from array
pv_model.SystemDesign.subarray1_use_custom_rot_angles = 1
pv_model.SystemDesign.subarray1_custom_rot_angles_array = stuck_tracker_data
pv_model.execute(1)
out = pv_model.Outputs.export()
tracker_predictions["Stuck_tracking"] = out["gen"]
tracker_predictions["custom_angles"] = out["subarray1_axisrot"]
tracker_predictions["calculated_temps"] = out["subarray1_celltemp"]

#Look at results
measured_data_stuck = measured_data.loc[datetime.date(2023, 9, 16):datetime.date(2023,9,17)]
measured_data_kW = measured_data_stuck["inverter_1_ac_power_(kw)_inv_150143"] #+ measured_data_stuck["inverter_2_ac_power_(kw)_inv_150144"]
#measured_data_kW = measured_data_stuck["inverter_2_ac_power_(kw)_inv_150144"]
tracker_predictions = tracker_predictions.set_index(measured_data_stuck.index.copy())
tracker_predictions["Stuck_tracking"].plot()
measured_data_kW.plot()
plt.legend(["Non-moving tracker", "Measured"])
plt.ylabel("Power (kW)")
Text(0, 0.5, 'Power (kW)')
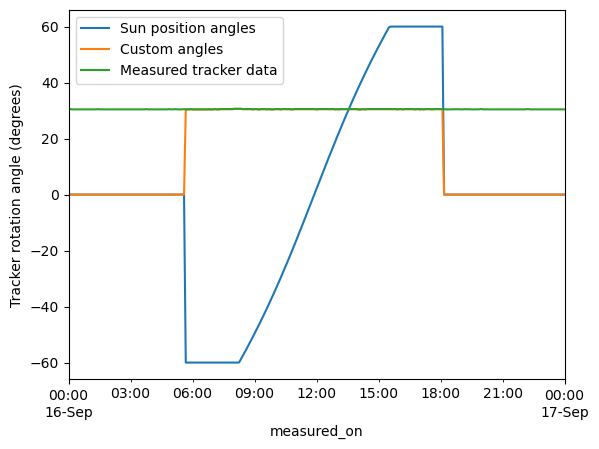
tracker_predictions["sun_angles"].plot()
tracker_predictions["custom_angles"].plot()
stuck_tracker_data.plot()
plt.legend(["Sun position angles", "Custom angles", "Measured tracker data"])
plt.ylabel("Tracker rotation angle (degrees)")
Text(0, 0.5, 'Tracker rotation angle (degrees)')
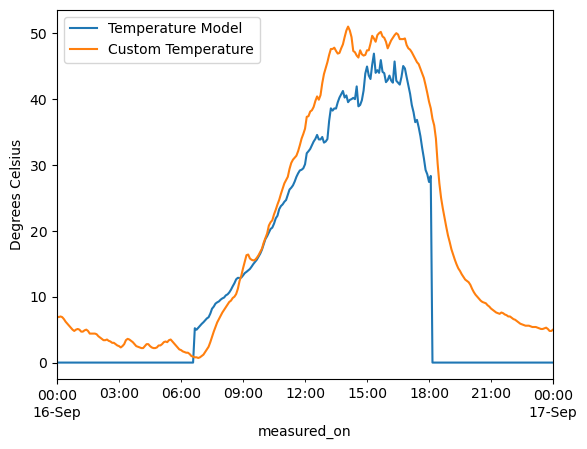
Custom module temperatures#
Replace cell temperature in calculation with user-defined cell temperatures
Useful for using cell temperature models not in SAM, using measured temperatures
Currently SDK only, evaluating for future integration into desktop tool
pv_model.SystemDesign.subarray1_use_custom_cell_temp = 1 #Turn on custom cell temperatures
pv_model.SystemDesign.subarray1_custom_cell_temp_array = amb_weather_data_example["thermocouple_pad_1_back-of-module_temperature_1_(c)_o_149728"]
pv_model.execute()
out = pv_model.Outputs.export()
tracker_predictions["custom_temps"] = out["subarray1_celltemp"]
tracker_predictions["calculated_temps"].plot()
tracker_predictions["custom_temps"].plot()
plt.legend(["Temperature Model", "Custom Temperature"])
plt.ylabel("Degrees Celsius")
Text(0, 0.5, 'Degrees Celsius')